


🧭June 8, 2025 Post 1: 🌏 The Pulse of Earth in Numbers: EnviStats India 2025 | High Quality Mains Essay | Prelims MCQs
🌏 The Pulse of Earth in Numbers: EnviStats India 2025
NATIONAL HERO
🗓️Post Date: June 8, 2025
📚 Thematic Focus: Environmental Statistics | Sustainability | Climate Trends
🪶 Opening Whisper:
In the silence of spreadsheets lies the voice of Earth — counting her tears, tallying her triumphs.
🔍 Key Highlights
📘 What is EnviStats India 2025?
- 8th edition of India’s environmental statistics report
- Released by Ministry of Statistics and Programme Implementation (MoSPI)
- Aligned with UN’s FDES 2013 framework, ensuring international comparability
- Published by the National Statistics Office (NSO)
📊 Environmental Trends and Indicators
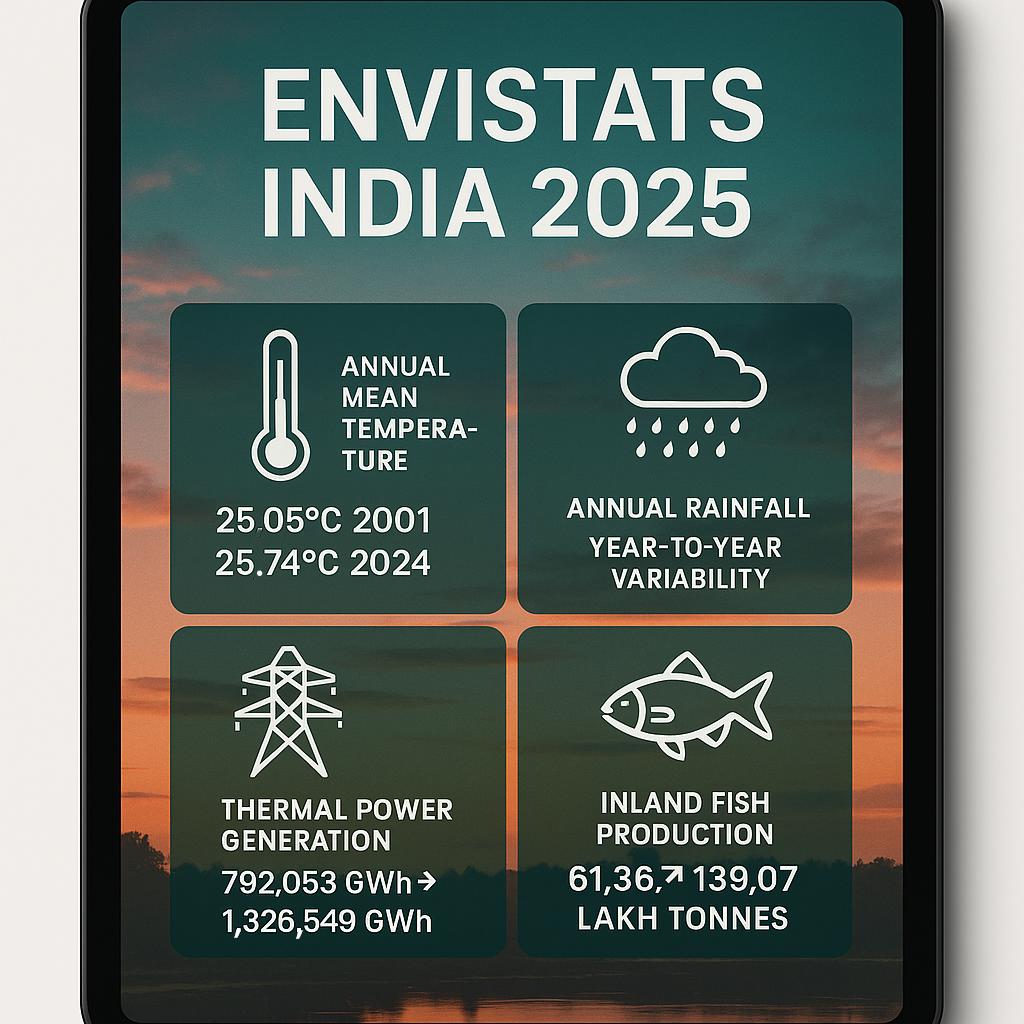
1. Temperature and Rainfall
- Annual mean temperature rose from 25.05°C (2001) to 25.74°C (2024)
- Minimum and maximum temperatures also climbed steadily
- Annual rainfall: Significant year-to-year variability, no long-term trend
2. Energy Generation
- Thermal power: 792,053 GWh → 1,326,549 GWh (2013–24)
- Renewable power: 65,520 GWh → 225,835 GWh
3. Inland Fish Production
- 2013–14: 61.36 lakh tonnes → 2023–24: 139.07 lakh tonnes
- Growth linked to aquaculture and freshwater fisheries
4. Faunal Diversity (India’s Share in Global Biodiversity)
- Marine species: 20,613 (of 2.47 lakh global)
- Freshwater species: 9,436
- Soil species: 22,404
- Total faunal species in India: 1,04,561 (of 16,73,627 global)
💰 Expenditure and Resource Allocation
- Environment Sustainability Sector: ₹2433.24 crore (highest among sectors)
- Conservation of Natural Resources: Upward trend
- Agro-Forestry Sector: Lowest allocation
🔄 Structural Improvements in EnviStats 2025
- Component-wise reorganisation for clarity and usability
- Introduction of new data on:
• Electricity Access
• Transport & Sanitation
• Ramsar Sites - Inclusion of FDES-aligned indicators list
- Prepared in consultation with domain experts and multiple ministries
🧭 GS Mains Mapping
Paper: GS Paper 3
Topics Covered:
- Environmental Conservation
- Climate Change Data
- Renewable Energy
- Biodiversity Statistics
- Government Reports & Sustainable Development Indicators
💭 A Thought Spark — by IAS Monk
“To protect nature, one must learn its language — and statistics is its silent tongue.”
Let the figures not just inform policies but awaken conscience.
High Quality Mains Essay For Practice :
Word Limit 1000-1200
Measuring the Pulse of the Planet: Analyzing EnviStats India 2025 and Its Role in Sustainable Governance
Introduction
In an era where climate volatility, biodiversity loss, and environmental degradation challenge the very foundation of development, the role of data-driven governance becomes indispensable. The release of EnviStats India 2025 by the Ministry of Statistics and Programme Implementation (MoSPI) serves not merely as a statistical compendium but as a strategic lens through which India observes and assesses its ecological balance. By adhering to international standards such as the UN’s Framework for the Development of Environment Statistics (FDES) 2013, EnviStats India offers a structured, transparent, and integrative portrait of the nation’s environmental trajectory.
This essay delves into the significance, methodology, key highlights, and policy implications of the latest edition of EnviStats India, underscoring its relevance in India’s transition toward sustainable and inclusive development.
Understanding EnviStats India: A Vision Beyond Numbers
Launched in 2018, the EnviStats series is India’s flagship environmental statistical publication, curated annually by the National Statistical Office (NSO). It captures trends across six components: Environmental Conditions and Quality, Environmental Resources and their Use, Residuals, Extreme Events, Human Settlements and Environmental Health, and Environmental Protection Expenditure.
The 2025 edition marks a significant restructuring and enhancement of the publication. It introduces a component-wise format aligned with the FDES 2013 model, thereby ensuring international comparability and improved accessibility for policymakers and researchers.
Key methodological advancements include:
- Integration of new indicators such as access to electricity, sanitation, and transport.
- Inclusion of a comprehensive Ramsar Sites list, reflecting India’s evolving commitment to wetland conservation.
- Enhanced indicator concordance mapping between national and international standards.
Key Environmental Indicators: What the Numbers Reveal
1. Climate Metrics: Rising Temperatures and Rainfall Variability
One of the most striking revelations from EnviStats India 2025 is the gradual rise in annual mean temperature—from 25.05°C in 2001 to 25.74°C in 2024. This steady increase underscores the tangible reality of global warming. Additionally, both minimum (19.32°C to 20.24°C) and maximum (30.78°C to 31.25°C) temperatures have risen, further suggesting a narrowing diurnal temperature range—often associated with urban heat islands and land use changes.
In contrast, rainfall trends show year-to-year variability, with no significant long-term increase or decrease. This volatility, largely influenced by the Indian monsoon system, presents complex challenges for agricultural planning, water security, and disaster management.
2. Energy Generation: Renewable Growth Amid Thermal Dominance
India’s energy profile continues to be dominated by thermal sources, with thermal power generation increasing from 792,053 GWh (2013-14) to 1,326,549 GWh (2023-24). However, renewable energy has also made significant strides, growing from 65,520 GWh to 225,835 GWh during the same period. This dual trend suggests a transitional phase in India’s energy strategy where clean energy is rising, but fossil fuel reliance remains entrenched.
3. Aquaculture and Inland Fish Production
A less discussed but vital highlight is the doubling of inland fish production from 61.36 lakh tonnes to 139.07 lakh tonnes in the past decade. This growth is driven by aquaculture expansion, improved seed quality, and better fisheries management. It also reflects changing dietary patterns and increasing demand for protein-rich food among Indian households.
4. Biodiversity Metrics: India’s Role in Global Faunal Diversity
EnviStats provides a nuanced mapping of faunal diversity, asserting that India is home to:
- 20,613 marine species
- 9,436 freshwater species
- 22,404 soil species
In total, 1,04,561 faunal species have been documented, contributing over 6% to global diversity (out of 16,73,627 globally recorded species). This biodiversity capital positions India as both a custodian and a beneficiary of ecological richness.
Public Expenditure on Environmental Sectors
The 2025 edition offers granular insights into sector-wise public expenditure:
- The Environment Sustainability Sector commands the highest share: ₹2,433.24 crore in 2021–22.
- The Conservation of Natural Resources Sector shows an upward allocation trend, indicating heightened governmental focus.
- The Agro-Forestry Sector, however, lags with the lowest expenditure, despite its critical role in carbon sequestration and rural livelihoods.
This financial data acts as a mirror for budgetary priorities, revealing the gaps between rhetoric and resource deployment in environmental governance.
Structural and Methodological Improvements
A commendable feature of EnviStats 2025 is its expert-driven revision process. A specialized group of domain experts and ministry officials worked to:
- Expand the scope of indicators,
- Refine data presentation, and
- Introduce user-centric restructuring.
Moreover, the component-wise alignment makes it easier for policymakers to map specific indicators to Sustainable Development Goals (SDGs), such as clean energy (SDG 7), clean water and sanitation (SDG 6), and climate action (SDG 13).
Significance and Implications for Policymaking
EnviStats India is not merely a technical document but a strategic policy tool. Its importance can be categorized under three dimensions:
1. Evidence-Based Policy Design
Ministries and State Governments can use these indicators to frame green budgets, evaluate climate resilience projects, and plan decarbonization strategies.
2. International Reporting and Climate Negotiations
The alignment with FDES 2013 enables India to submit standardized environmental data in global forums such as UNFCCC, CBD, and G20.
3. Academic and Public Discourse
Universities, think tanks, and civil society organizations rely on such data to assess policy outcomes, build environmental literacy, and monitor local implementation of national missions.
Challenges and Way Forward
Despite its improvements, EnviStats India faces limitations:
- Data Gaps: Some indicators, particularly on air quality, soil degradation, and e-waste, lack temporal depth and granularity.
- State-Level Disparities: Uniform national-level aggregation often hides critical regional imbalances.
- Public Accessibility: Despite online availability, data remains underutilized due to technical jargon and lack of interactive visualizations.
To address these, the following steps are suggested:
- Integrate Real-Time Environmental Monitoring using satellite and sensor networks.
- Collaborate with State Statistical Bureaus to enhance bottom-up data collection.
- Visual Dashboards and multilingual platforms to democratize access.
Conclusion
EnviStats India 2025 is more than a report — it is a national pulse-check on our ecological well-being. In a time of increasing climate uncertainty, environmental statistics are not just academic exercises; they are instruments of governance, accountability, and hope. As India marches toward its Net-Zero 2070 goal, such structured assessments must guide both policy intent and citizen action. The Earth has long spoken through winds, rivers, and wildfires. EnviStats gives her a voice in numbers.
Quote to End With:
“What gets measured, gets managed — and what gets ignored, gets destroyed.”
Target IAS-26: Daily MCQs :
📌 Prelims Practice MCQs
Topic:
MCQ 1 – Type 1: How many of the above statements are correct?
Consider the following statements regarding EnviStats India 2025:
1. It follows the UN’s Framework for the Development of Environment Statistics (FDES) 2013.
2. It is published by the Ministry of Environment, Forest and Climate Change.
3. Inland fish production in India has declined steadily since 2013-14.
4. The report includes data on energy generation and environmental expenditure.
How many of the above statements are correct?
A) Only two
B) Only three
C) All four
D) Only one
🌀 Didn’t get it? Click here (▸) for the Correct Answer & Explanation
✅ Correct Answer: A) Only two
🧠 Explanation:
•1) ✅ True – EnviStats India follows the UN’s FDES 2013 for global comparability.
•2) ❌ False – It is published by the National Statistics Office under MoSPI, not MoEFCC.
•3) ❌ False – Fish production has increased, not declined.
•4) ✅ True – The report includes extensive data on energy and public expenditure in sectors like sustainability and conservation.
MCQ 2 – Type 2: Two Statements Based
Consider the following two statements:
1. EnviStats India 2025 shows that the annual mean temperature in India has remained constant between 2001 and 2024.
2. The Environment Sustainability Sector had the highest expenditure among the three sectors reported.
Which of the above statements is/are correct?
A) Only 1 is correct
B) Only 2 is correct
C) Both are correct
D) Neither is correct
🌀 Didn’t get it? Click here (▸) for the Correct Answer & Explanation
✅ Correct Answer: B) Only 2 is correct
🧠 Explanation:
•1) ❌ False – The temperature rose from 25.05°C to 25.74°C.
•2) ✅ True – The Environment Sustainability Sector had the highest allocation.
MCQ 3 – Type 3: Which of the statements is/are correct?
Which of the following statements about environmental trends in EnviStats India 2025 are correct?
1. Annual rainfall in India shows a consistent upward trend over the past two decades.
2. Thermal power generation has increased significantly since 2013-14.
3. India accounts for more than 6% of the world’s faunal species.
4. EnviStats India includes information on Ramsar Sites.
Select the correct code:
A) 1, 2 and 3 only
B) 2, 3 and 4 only
C) 1, 3 and 4 only
D) 1, 2 and 4 only
🌀 Didn’t get it? Click here (▸) for the Correct Answer & Explanation
✅ Correct Answer: B) 2, 3 and 4 only
🧠 Explanation:
•1) ❌ False – Rainfall data shows variability, not an upward trend.
•2) ✅ True – Thermal generation increased from 792,053 GWh to 1.3 million+ GWh.
•3) ✅ True – India hosts ~6% of global faunal species.
•4) ✅ True – Ramsar site data was included for the first time.
MCQ 4 – Type 4: Direct Fact
Which of the following organizations prepares and publishes the EnviStats India report?
A) Ministry of Environment, Forest and Climate Change
B) National Biodiversity Authority
C) National Statistics Office under MoSPI
D) NITI Aayog
🌀 Didn’t get it? Click here (▸) for the Correct Answer & Explanation.
✅ Correct Answer: C) National Statistics Office under MoSPI
🧠 Explanation:
••NSO under MoSPI prepares and publishes EnviStats India annually.