

🧭June 1, 2025 Post 3: When the Line Moves Upward: India’s Quiet Exit from Mass Poverty | High Quality Mains Essay | Prelims MCQs
When the Line Moves Upward: India’s Quiet Exit from Mass Poverty
NATIONAL
Post Date: June 1, 2025
Thematic Focus: GS3 / Indian Economy
🪷 Intro Whisper
In a country where poverty once defined policy, not just statistics, a silent revolution is unfolding. With fewer headlines but deeper footprints, India’s poorest are beginning to rise — one consumption basket at a time.
🔍 Key Highlights
- Poverty Drop (2022–2024):
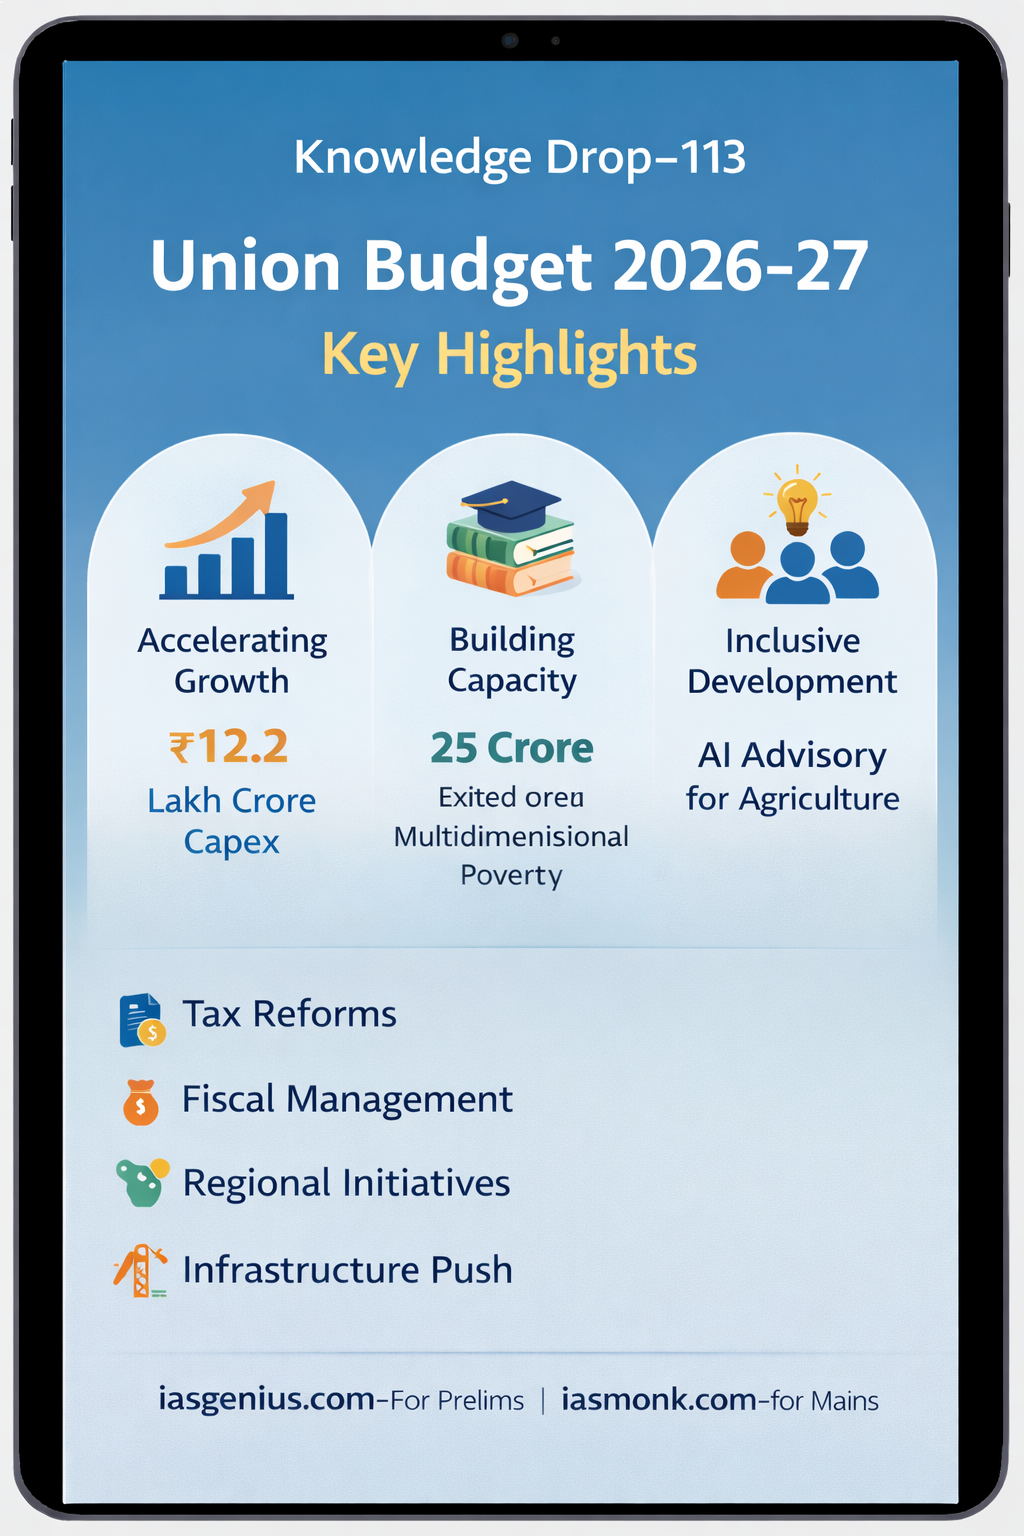
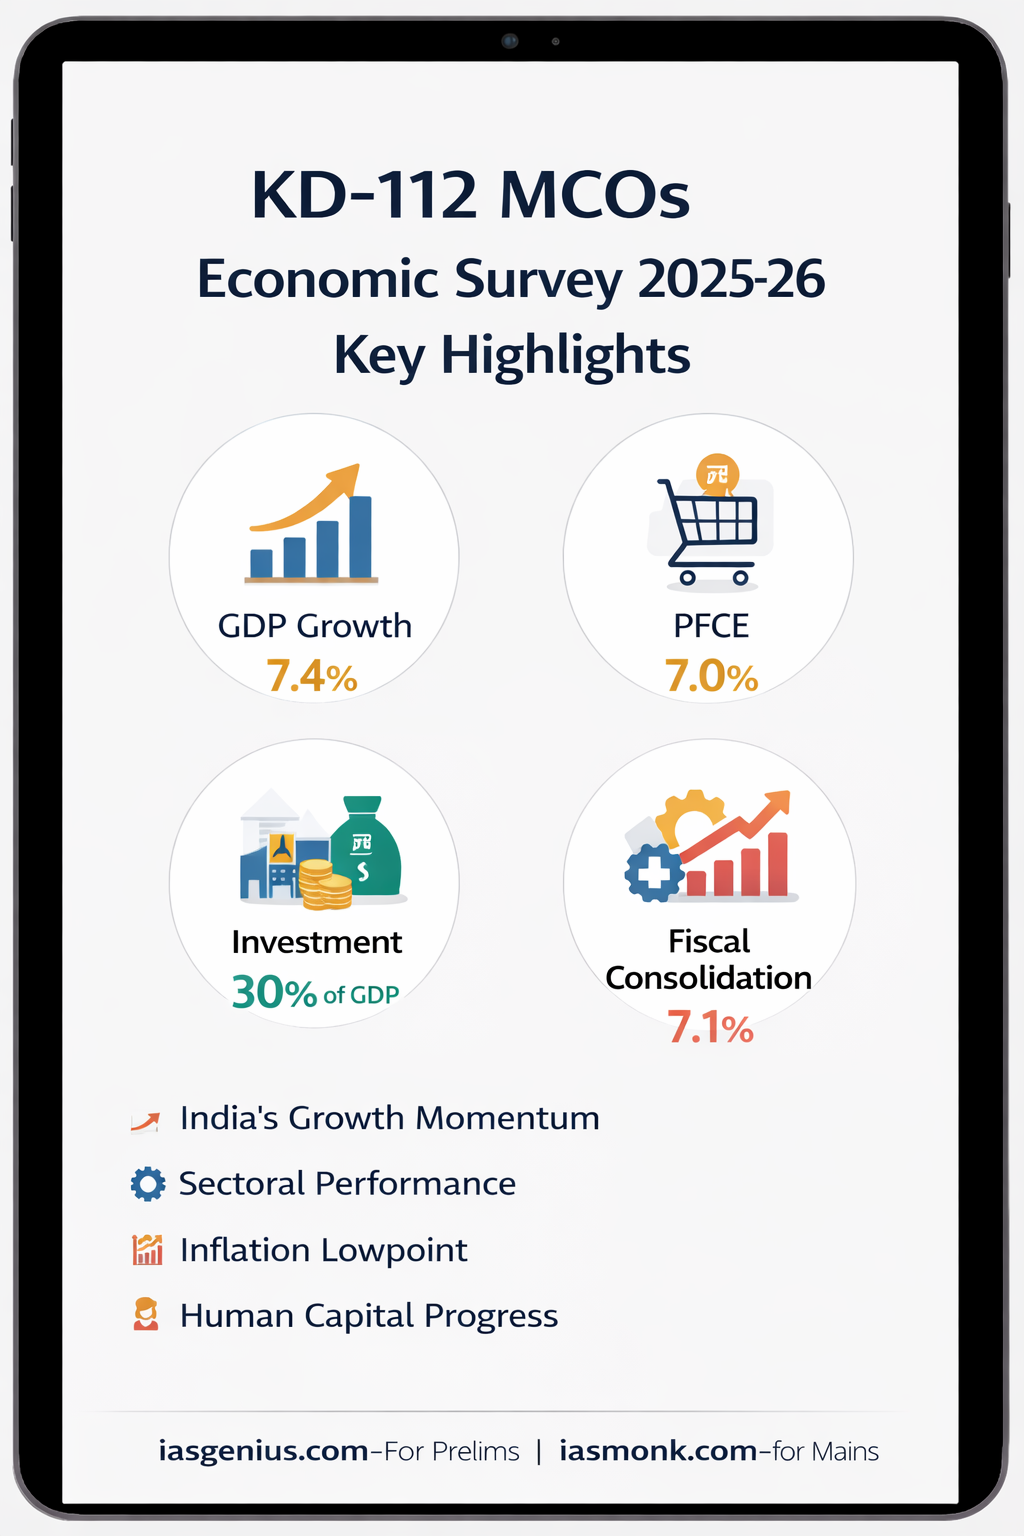
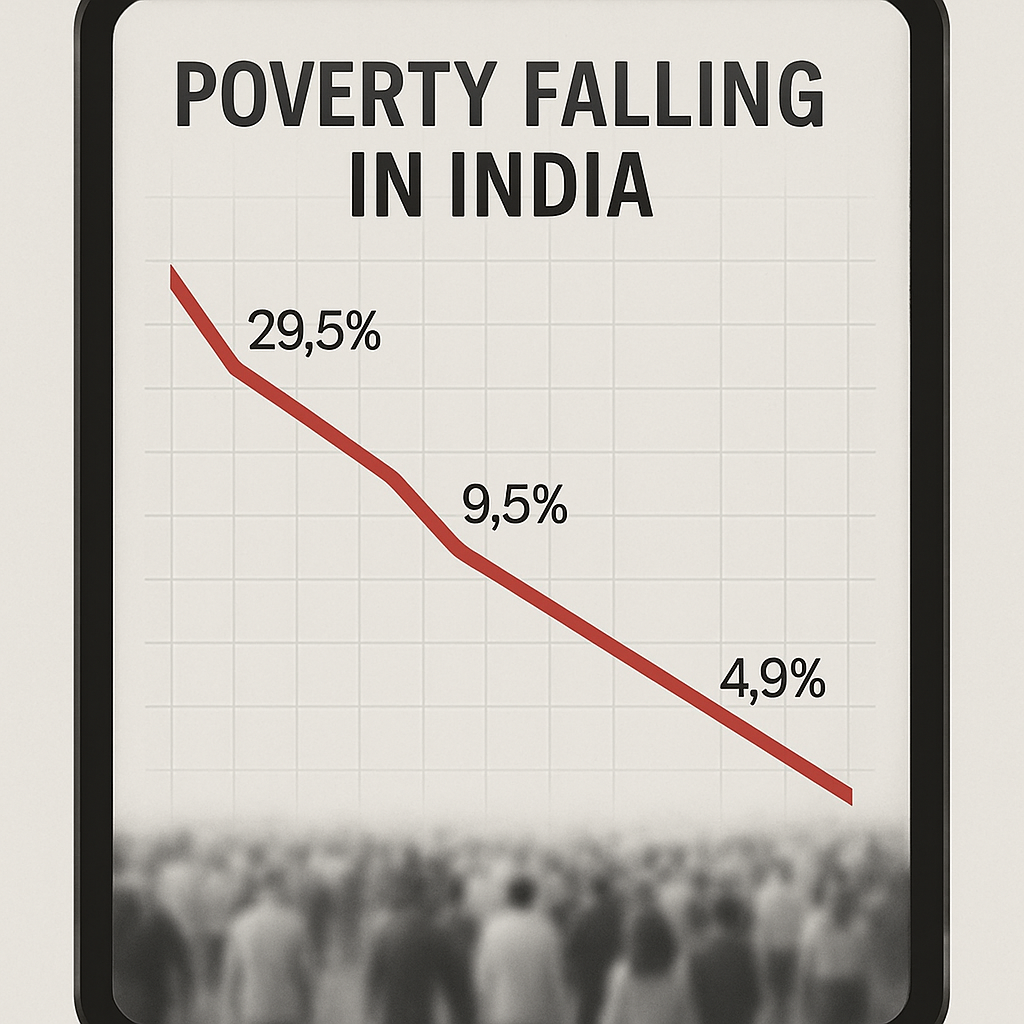
As per the Household Consumption Expenditure Surveys (HCES) by NSO, poverty in India has dropped from 29.5% in 2011–12 to 9.5% in 2022–23 and further to 4.9% in 2023–24. - Global Validation:
The World Bank Poverty & Equity Brief noted that India’s extreme poverty fell from 16.2% to 2.3% in the same period (2011–2023). - Inequality Trends:
The Gini Coefficient declined from 0.310 (2011–12) to 0.253 (2023–24) — indicating modest reduction in consumption inequality. - Historical Context:
Evolution of poverty estimation in India has seen shifts:- 1971: Dandekar & Rath (calorie-based ₹15/₹22.5 line)
- 1979: Alagh Committee (2400/2100 calorie-based)
- 1993: Lakdawala Committee (regional price index)
- 2009: Tendulkar Committee (health, education, price-adjusted)
- 2014: Rangarajan Committee (not adopted officially)
- Updated Global Line:
In September 2022, the World Bank revised the global poverty line to $2.15/day per person (PPP adjusted).
🧭 Concept Explainer: Gini Coefficient & Poverty Lines
- Gini Coefficient: Measures income/consumption inequality. 0 = Perfect equality, 1 = Perfect inequality. India’s drop to 0.253 signals improved equity.
- Poverty Line: A monetary threshold for basic survival. In India, it evolved from calorie norms to consumption expenditure covering essentials like health, food, housing, etc.
🧱 Government Initiatives that Mattered
- Employment & Welfare:
MGNREGS, SGSY, SJSRY — large-scale rural and urban employment generation. - Food Security:
National Food Security Act, free grain extension under PM-GKAY for 5 more years. - Health & Nutrition:
Poshan Abhiyan, Anemia Mukt Bharat, Ujjwala Yojana for clean fuel, maternal and child healthcare. - Basic Needs Revolution:
Saubhagya (electricity), Swachh Bharat, Jal Jeevan Mission — enhancing living conditions at scale. - Financial & Housing Inclusion:
Jan Dhan Yojana, PM Awas Yojana — reaching the last mile.
📚 GS Paper Mapping
- GS Paper 3 – Indian Economy
→ Growth and Development
→ Inclusive Development
→ Poverty and Unemployment
→ Government Schemes
🌱 A Thought Spark — by IAS Monk
“When poverty retreats without a headline, the silent effort of many begins to sing. True development isn’t in numbers — it’s in the rising dignity of everyday life.”
High Quality Mains Essay For Practice :
Word Limit 1000-1200
Poverty: A Game of Numbers or a Crisis of Dignity?
Is Poverty a Number Game or Beyond It?
Introduction
For decades, the story of poverty has been told through numbers: the percentage below a line, the number of rupees per day, the consumption expenditure per person. These figures travel across graphs, reports, and parliamentary debates. Yet poverty, as lived and felt, is far more than a statistic. While numbers help measure the magnitude of the problem, they often miss its emotional, cultural, and intergenerational depth. As India reports significant progress in poverty reduction — from 29.5% in 2011–12 to 4.9% in 2023–24 — the real question resurfaces: Is poverty merely a numerical benchmark, or does it encompass deeper dimensions of deprivation and dignity?
The Evolution of Poverty: From Calories to Capabilities
The historical attempts to define poverty in India show an evolution from calorie-based thresholds to multidimensional views:
- 1971 (Dandekar & Rath): Based on 2,250 calories per person/day; poverty line was ₹15 for rural, ₹22.5 for urban.
- 1979 (Alagh Committee): Adjusted calorie norms — 2,400 for rural and 2,100 for urban — became the national standard.
- 1993 (Lakdawala Committee): Focused on state-specific poverty lines, incorporating price differences.
- 2009 (Tendulkar Committee): Shifted emphasis from calories to actual consumption patterns including health and education.
- 2014 (Rangarajan Committee): Suggested higher thresholds but was not adopted officially.
Each transition attempted to better reflect poverty’s reality, yet remained focused on “who falls below the line,” keeping the debate statistical.
Poverty as a Number Game: The Case For Metrics
There are strong reasons why numbers continue to dominate the poverty discourse:
- Policy Planning: Governments need quantifiable data to design and target welfare schemes. Without numerical benchmarks, universalisation becomes inefficient or unaffordable.
- Comparative Analysis: Global institutions like the World Bank rely on thresholds (e.g., $2.15/day PPP) to compare poverty levels across countries and time periods.
- Monitoring Progress: India’s claims of reduced poverty — supported by recent NSO Household Consumption Expenditure Surveys — can only be made through consistent, measurable data.
- Resource Allocation: Budgetary priorities like food subsidies, MGNREGS funding, or PDS expansion are based on how many people are classified as poor.
- Electoral Accountability: Numbers simplify communication to the public. A headline that says “Poverty falls to 4.9%” is politically powerful, even if imperfect.
Thus, numbers serve as both a governance tool and a communication instrument. Yet their dominance also leads to oversimplification.
What Numbers Miss: The Human Face of Poverty
While statistics define boundaries, they rarely capture the texture of poverty. A family earning ₹70 more than the poverty line might escape a report’s radar but still lack secure food, health, housing, or hope. Poverty is often:
- Volatile and Fragile: Many “non-poor” live just above the poverty line. A health emergency or job loss can push them back into poverty. Numbers miss this vulnerability.
- Multidimensional: Poverty includes poor nutrition, illiteracy, unsafe housing, lack of clean water, and social exclusion. These dimensions are harder to measure but profoundly real.
- Intergenerational: A poor child may be statistically above the poverty line, yet trapped in cycles of low education, limited access, and minimal mobility.
- Socially Embedded: Caste, gender, and geography influence how poverty is experienced. A Dalit woman in rural India faces more complex barriers than the same income-level man in an urban slum.
- Dignity and Aspirations: Poverty is not just deprivation of resources — it’s often deprivation of choice, of voice, of visibility. Numbers rarely reflect these nuances.
Beyond the Line: A Case for Multidimensional Poverty Index (MPI)
To address the inadequacy of income-based definitions, many nations, including India through the NITI Aayog, now use the Multidimensional Poverty Index (MPI). This index includes:
- Health Indicators: Nutrition, child mortality
- Education Indicators: Years of schooling, school attendance
- Standard of Living: Cooking fuel, sanitation, drinking water, electricity, housing, and assets
India’s MPI 2023 data showed that 135 million people exited multidimensional poverty between 2015–21, a sign that progress was more layered than income figures alone could reveal.
This approach reaffirms that poverty is not just about money — it’s about meaningful access to life’s essentials.
The Indian Paradox: Growth with Uneven Wellbeing
India’s rapid GDP growth has often been accompanied by stubborn inequality. Even when poverty percentages fall:
- Rural–Urban Gaps persist
- Top 1% wealth concentration increases
- Gender disparities in labor force participation remain wide
- Access to quality public education or health remains poor despite rising incomes
Thus, while absolute poverty may reduce, relative poverty and capability deficits continue, reminding us that we must look beyond the line.
Why the Narrative Matters
Framing poverty purely in numeric terms creates four risks:
- Policy Complacency: If poverty falls below 5%, there’s a risk governments may downscale welfare spending prematurely.
- Exclusion Errors: People who are barely above the line may lose access to benefits they still need.
- Public Misperception: Citizens may be misled into believing poverty is “solved,” weakening democratic demands for equity.
- Erasure of Inequality: Aggregate data hides intra-state, caste, tribal, or gendered variations. Numbers flatten complex realities.
Hence, a richer vocabulary and deeper frameworks are necessary — ones that speak of vulnerability, dignity, and capability — not just percentages.
Role of State and Society: Bridging Metrics and Meaning
India has implemented several critical schemes that help push people out of poverty not just statistically but meaningfully:
- PM Garib Kalyan Anna Yojana: Food security for over 80 crore people
- Ujjwala Yojana: Clean cooking fuel, reducing health burdens
- Ayushman Bharat: Health coverage for 50 crore citizens
- Swachh Bharat Mission: Reducing disease burden through sanitation
- PM Awas Yojana: Providing safe shelter and property ownership
- Jal Jeevan Mission: Functional tap connections in rural India
- MGNREGS: Wage security during lean agricultural seasons
These efforts prove that when poverty is treated as a lived experience, not just a number, transformative change is possible.
The Path Forward: Rethinking Metrics with Meaning
To truly understand and eliminate poverty, India needs:
- Blended Indicators: Combine income-based measures with MPI, subjective wellbeing, and nutritional markers.
- Real-Time Monitoring: Move beyond decadal surveys to more dynamic poverty tracking using digital platforms and local data.
- Vulnerability Indexing: Identify those “above the line but below security” to prevent fallback into poverty.
- Localized Narratives: Empower state and district-level MPI dashboards, enabling decentralized and tailored interventions.
- Voice of the Poor: Include lived experiences in policymaking — through participatory forums, social audits, and grievance systems.
Conclusion
Poverty is not a line — it is a shadow that stretches across health, education, opportunity, and dignity. While numbers help us diagnose the scale of the problem, they are not the cure. The true measure of a nation’s development lies not in how few fall below the poverty line, but in how many rise above it in wellbeing, capability, and hope.
So, is poverty a number game?
Yes — but only if we let it be.
The real question is: Can we see beyond the numbers to the lives behind them?
Target IAS-26: Daily MCQs :
📌 Prelims Practice MCQs
Topic: Poverty in India
MCQ 1 – Type 1: How many of the above statements are correct?
Consider the following statements about poverty measurement in India:
1. The Tendulkar Committee recommended calorie-based poverty lines with separate urban and rural thresholds.
2. The Lakdawala Committee moved away from calorie norms and introduced state-specific poverty lines based on expenditure.
3. The Rangarajan Committee’s recommendations were officially adopted by the Government of India.
4. The Multidimensional Poverty Index (MPI) considers education, health, and standard of living indicators.
How many of the above statements are correct?
A) Only two
B) Only three
C) All four
D) Only one
🌀 Didn’t get it? Click here (▸) for the Correct Answer & Explanation
✅ Correct Answer: A) Only two
🧠 Explanation:
•1) ❌ False – The Tendulkar Committee moved away from calorie-based norms; it included education and health-related spending in poverty estimation.
•2) ✅ True – The Lakdawala Committee did shift to state-specific poverty lines, considering expenditure patterns and price differences.
•3) ❌ False – The Rangarajan Committee proposed new lines, but the government did not adopt them officially.
•4) ✅ True – The MPI is explicitly based on education, health, and standard of living indicators.
MCQ 2 – Type 2: Two Statements Based
Consider the following statements:
1. The Gini coefficient measures income inequality, with 0 indicating perfect equality.
2. As per latest NSO data, poverty in India dropped below 5% in 2023–24.
Which of the above statements is/are correct?
A) Only 1 is correct
B) Only 2 is correct
C) Both are correct
D) Neither is correct
🌀 Didn’t get it? Click here (▸) for the Correct Answer & Explanation
✅ Correct Answer: C) Both are correct
🧠 Explanation:
•1) ✅ True – Gini coefficient ranges from 0 (perfect equality) to 1 (perfect inequality).
•2) ✅ True – According to Household Consumption Expenditure Survey, poverty fell to 4.9% in 2023–24.
MCQ 3 – Type 3: Which of the statements is/are correct?
Which of the following schemes have been instrumental in reducing multidimensional poverty in India?
1. Pradhan Mantri Awas Yojana
2. Swachh Bharat Mission
3. National Food Security Act
4. Ayushman Bharat Scheme
Select the correct code:
A) 1 and 2 only
B) 1, 2 and 3 only
C) 1, 3 and 4 only
D) 1, 2, 3 and 4
🌀 Didn’t get it? Click here (▸) for the Correct Answer & Explanation
✅ Correct Answer: D) 1, 2, 3 and 4
🧠 Explanation:
•1) ✅ PMAY improves housing security, a core MPI indicator.
•2) ✅ Swachh Bharat improved sanitation and hygiene.
•3) ✅ NFSA ensured access to subsidized food grains.
•4) ✅ Ayushman Bharat expanded access to healthcare.
MCQ 4 – Type 4: Direct Fact
Which of the following is the latest global poverty line as defined by the World Bank (as of 2022)?
A) $1.90/day per person (PPP)
B) $2.15/day per person (PPP)
C) $1.25/day per person (PPP)
D) $3.20/day per person (PPP)
🌀 Didn’t get it? Click here (▸) for the Correct Answer & Explanation.
✅ Correct Answer: B) $2.15/day per person (PPP)
🧠 Explanation:
•• In September 2022, the World Bank revised the global poverty threshold from $1.90 to $2.15/day per person, adjusted for 2017 PPP.